Powerful Solutions for Institutions & Nonprofits
Stop scrambling to create tedious text-based reports. Use visual data dashboards to rigorously track and demonstrate your impact to funders and the public.
Focus on Data for Impact
Our platform powers data-driven initiatives for multiple organizations and non profit .

Monitor what matters most to you
Monitor any entity using baseline data. Collect is the only app in the world with built-in monitoring that works offline. Track entities (people, places, projects, and more) over time.
Never re-enter baseline information again.Don't waste your time entering the same baseline data over and over again. Simply view all your entities, filter the results, and choose the right on
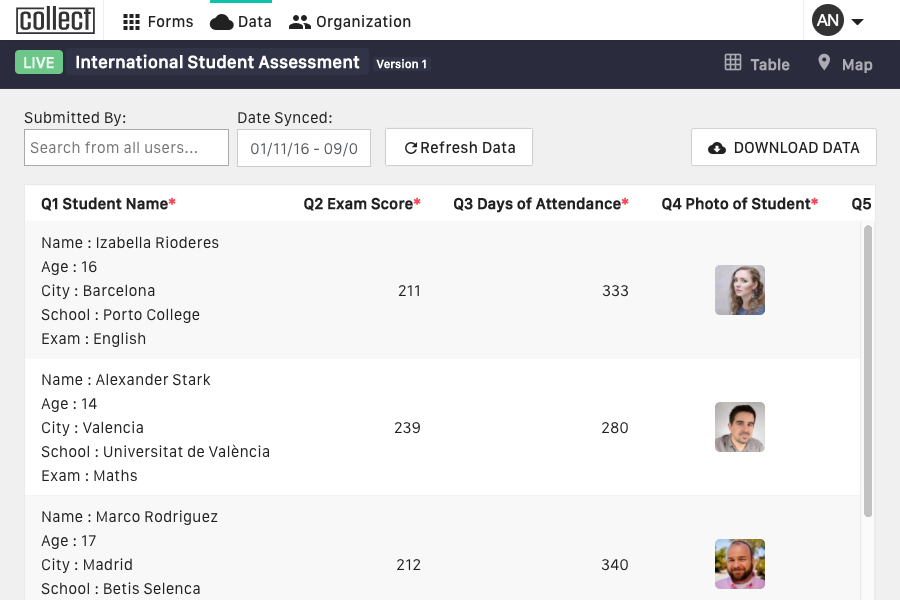
View data in real time
Monitor data as it comes in and flag errors and inconsistencies. This lets your field team resurvey flagged questions so you will have complete, accurate data every time.
Unify baseline, program, and impact data
Collect baseline data at the beginning of your project, monitor every interaction with beneficiaries, use intelligent flags to detect potential problems, and assess your impact — all in the same place.
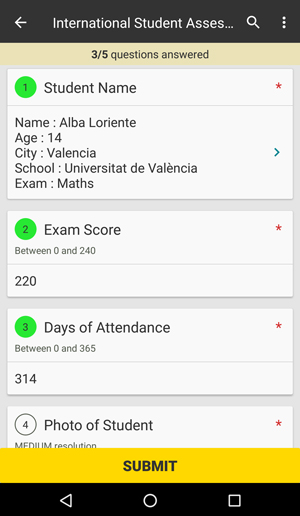
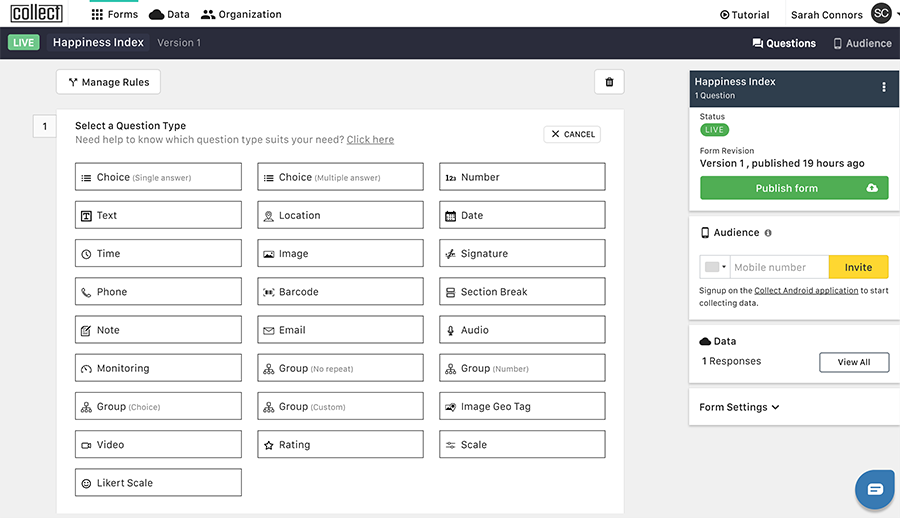
Real-time data — from the field to your fingertips
Set up the most complex data collection application in minutes — no coding required. Then let your field staff collect data on low-cost Android phones or tablets without internet..
Data analysis has become an imperative for organizational decisions and success. The velocity and volume of data increases as technology, sales channels, and data sources expand. The ability to control and harness the value of data is critical. To utilize data as a corporate asset, a comprehensive strategy around data management ensures accessibility and standardization.
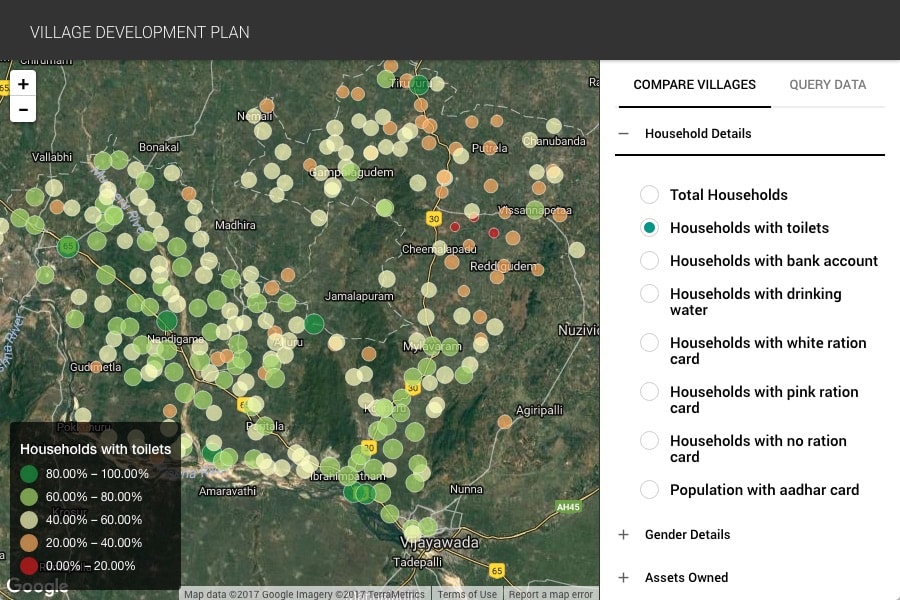
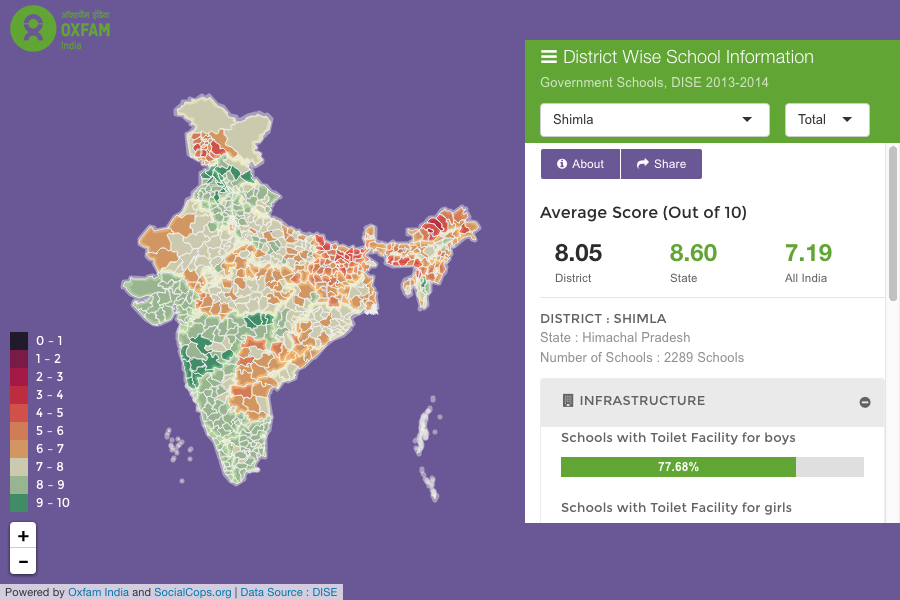
Drill down to any geography
Identify clusters for development Mapping makes it easy to find hidden patterns
Query and identify focus areas
Decision makers can create queries like “villages with no bus stations and population > 5,000 people”.
View comprehensive profiles
All the data — healthcare, education, infrastructure and more.
Communicate your data to the public
Promote transparency and communicate your impact through beautiful graphs and charts. Use static visualizations for reports or interactive ones to engage with the public.